Portfolio table
The Portfolio acts as the central hub for all projects, offering a comprehensive view of the entire project portfolio. It delivers a structured overview, enabling you to organize, analyze, and compare projects across various dimensions, supporting efficient management and strategic insight.
Portfolio structure
Projects are grouped by owner and categorized into folders.
Project owner
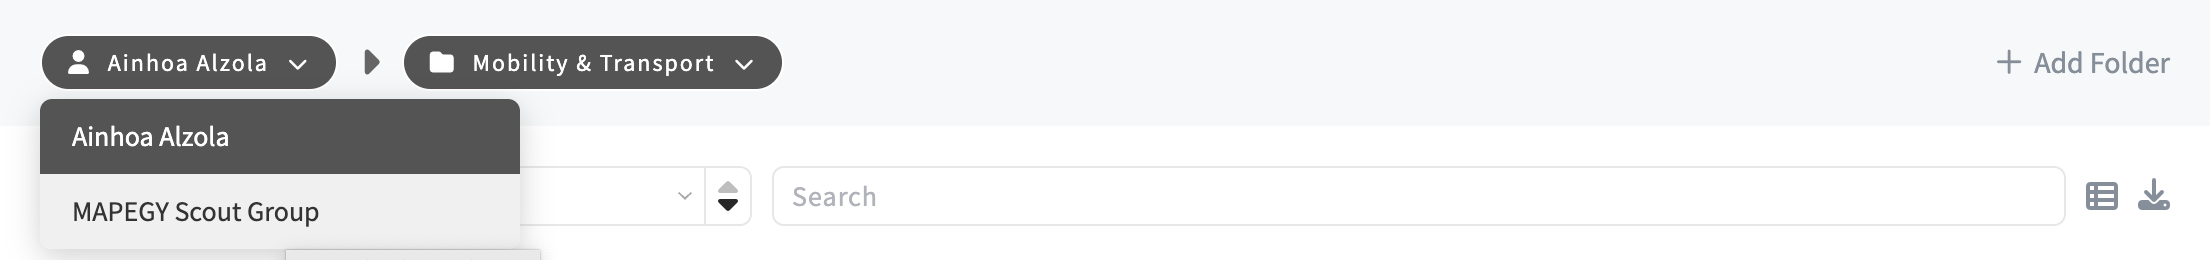
The Portfolio view defaults to displaying projects owned by the current user, helping you stay focused on your own work. At the top of the screen, the Groups dropdown allows you to manage your view.
To explore projects owned by groups, simply select the corresponding group name.
To learn more about Project ownership, check out this article.
Folders
The second dropdown of your Portfolio displays the folders owned by the selected owner, whether that's you (the current user) or a group you're part of. This section helps you navigate and manage projects within their respective folders.
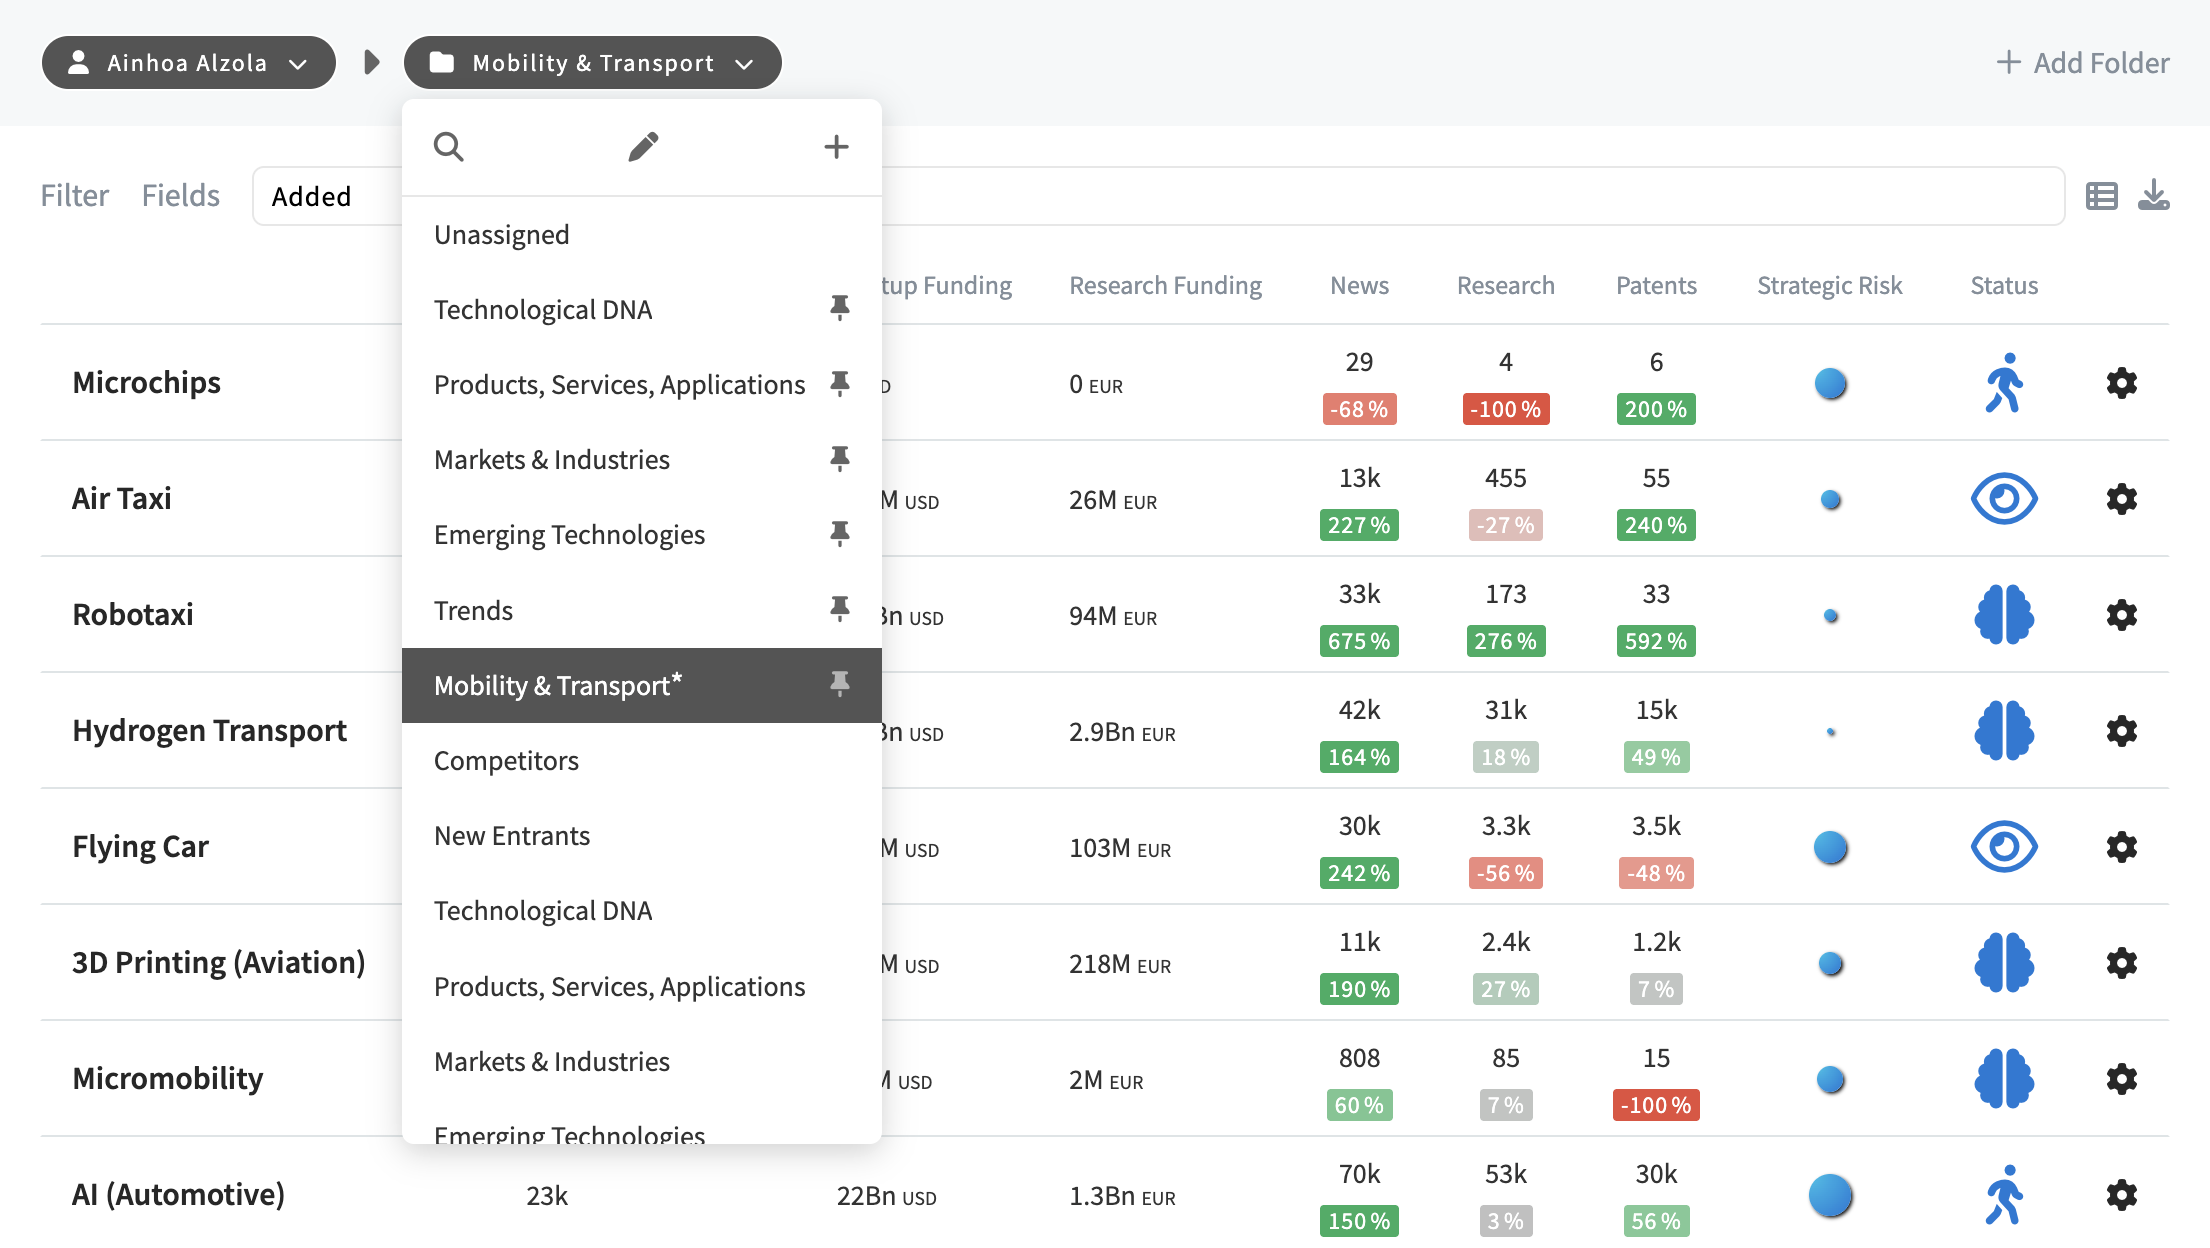
- Create a new folder: Simply click on the + button. The new folder will be added to your current owner view.
Additionally, you can click on the +Add folder button on the right of the screen. - Pin your folders: Hover over the right side of the folder name to reveal the pin icon. Click the pin icon to pin the folder to the top of the menu.
Have a look at this article to learn more about folders.
Projects
The project view serves as the centerpiece of the Portfolio, offering a comprehensive overview of all projects within your selected folders. Here, you can explore key details, including MAPEGY and user indicators, queries, and access project settings.
Project views
There are two different views for your projects. Both complement each other, enabling to track progress, assess performance, and adapt strategies across both the big picture and detailed analysis.
- Grid view. Provides a broad perspective of projects with a visually appealing summary, highlighting key details such as project titles and descriptions to help you prioritize and navigate their portfolio with ease.
- List view. Delivers a detailed perspective, allowing you to dive deep into data analysis, evaluate their portfolio based on various KPIs, track performance, and make data-driven decisions.
In order to change views, just click on the toggle button next to the search bar.
Project fields
The project view allows you to customize which fields are visible, tailoring the display to your needs.
To customize the fields displayed in your Project View:
- Click on the Fields option on the left side of the screen.
- Select the fields you want to display, and click Ok. This will become your default view each time you access your portfolio.
Here’s a breakdown of the available options:
- MAPEGY and User Indicators: These help you rank and analyze your projects using both automated, data-driven metrics and custom KPIs. You can choose which indicators to display, ensuring relevance to your workflow. Automated indicators are updated monthly. Read more in this article.
- Query: Displaying the query field can be particularly useful for comparing similar queries and understanding their differences. Clicking on a query launches the search outside your portfolio for further exploration.
- Owner: This field shows the owner of each project.
- Thumbnail: Displaying thumbnails provides a visual preview of each project, helping you quickly identify and navigate through your portfolio.
Note: Depending on your screen size, not all selected fields may be visible in the list view. If this occurs, you’ll see an exclamation mark next to the field settings, indicating adjustments may be needed for optimal display.
Project filters
You can also refine your project view by applying filters to focus on specific criteria. To apply filters, simply click on the Filter Settings. All available filters will be displayed, allowing you to customize your view based on your specific needs.
- Indicators: Select the minimum and/or maximum values for any indicator to filter projects based on specific thresholds. Additionally, you can filter by status, another key indicator, to focus on projects in particular phases or stages.
- Query Terms: Filter projects by specific query terms to compare or isolate related searches.
- Tags: Use this filter to display projects with activated alerts or projects using Smart Search.
Project sorting
You can organize your projects by any indicator as well as by added date or title.
To sort your projects, simply click on the dropdown menu above the project view to select your sorting criteria. Use the arrows to choose between ascending or descending order.
Export your Portfolio
You can export your table to various formats, including CSV, PNG, ODS, XLS, or XLSX, allowing you to share, analyze, or archive your data in the format that best suits your needs.