Trends: Investments
The Investments provides a trend chart illustrating the annual investment amounts related to your search, while also ranking investees based on various metrics.
It displays investment trends, offers insights into funding flows, and highlights top-funded and emerging companies, presenting valuable opportunities for potential investments.

This feature includes a graph showing the yearly funding amounts received by organizations over the past 10 years.
Below is a table listing the top 500 funded organizations (the investees).
Filter by year
You can use the charts to filter by year:
- Hover over any bar to see the amount of funding by year.
- Click on a bar to set it as the start date of your filter. Click on another bar to set it as the end date, completing your selected time frame. The organizations below will then be filtered to match the chosen date range.
Filtering by date will load a new set of 500 results.
Ranking fields
The ranking provides various fields that offer valuable insights into each organization. These include indicators, automated metrics that provide measurable insights into an organization's performance or activity, and contextual information that provide additional information.
Indicators
Indicators provide measurable values that quantify various aspects, offering key insights into the organization’s position and significance.
- Global score. This indicator measures an organization’s overall influence and impact in the broader world of innovation and technology, independent of any specific domain or query context. It provides a general assessment of the organization's significance across all areas of activity, offering a baseline metric for its prominence in the global innovation landscape.
- Relevance. This indicator measures how strongly an organization is connected to your query. A higher Relevance score indicates a closer alignment with the search topic or organization. Sorting by Relevance can help uncover smaller, specialized organizations that might be potential hidden champions. Since it is query-dependent, the Relevance value can vary based on the focus of your search.
- Impact. This indicator reflects the overall influence of an organization within the ecosystem defined by your query. It is calculated as the Global Score multiplied by Relevance, combining the organization’s digital footprint across patenting, research, and public visibility. Because it depends on your query, the Impact value may change if the query changes, even if the organization remains connected to it.
- Publication activity. This set of indicators provides a percentage-based estimate of an organization’s activity across three key areas:
- News. Represents the relative amount of news publications related to both your query and the organization.
- Research. Reflects the organization’s research activity within the context of your query.
- Patents. Indicates the organization’s patenting activity relevant to your query.
If you want to learn more about these indicators, check out our whitepaper.
Contextual information
These following fields help contextualize the organization's characteristics.
- Match type. This field, located below the organization's name in the rankings, classifies organizations based on their connection to your query.
- Peers: Organizations with similar innovation footprints, reflecting comparable activities or contributions within your search domain.
- Partners: Organizations that collaborate by pooling resources to achieve shared goals and enhance their innovation impact.
- Direct Matches: Organizations that directly align with your query, such as a specific company or institution you searched for.
- Founded. The organization’s founding year.
- Funding. The amount of external funding received by investors.
- Country, City. This is where the organization was founded, or where the headquarters, main office etc. are located.
- Employees. Number of employees.
- Revenue. Amount of revenue for an organization.
- Sector. Categories hand-tailored by MAPEGY: Mobility, Electronics & Consumer Goods, Industrials, IT & Telecommunications, Life & Food Sciences, Energy & Infrastructure, Materials & Chemicals, Business & Finance, Culture & Society.
Reference section
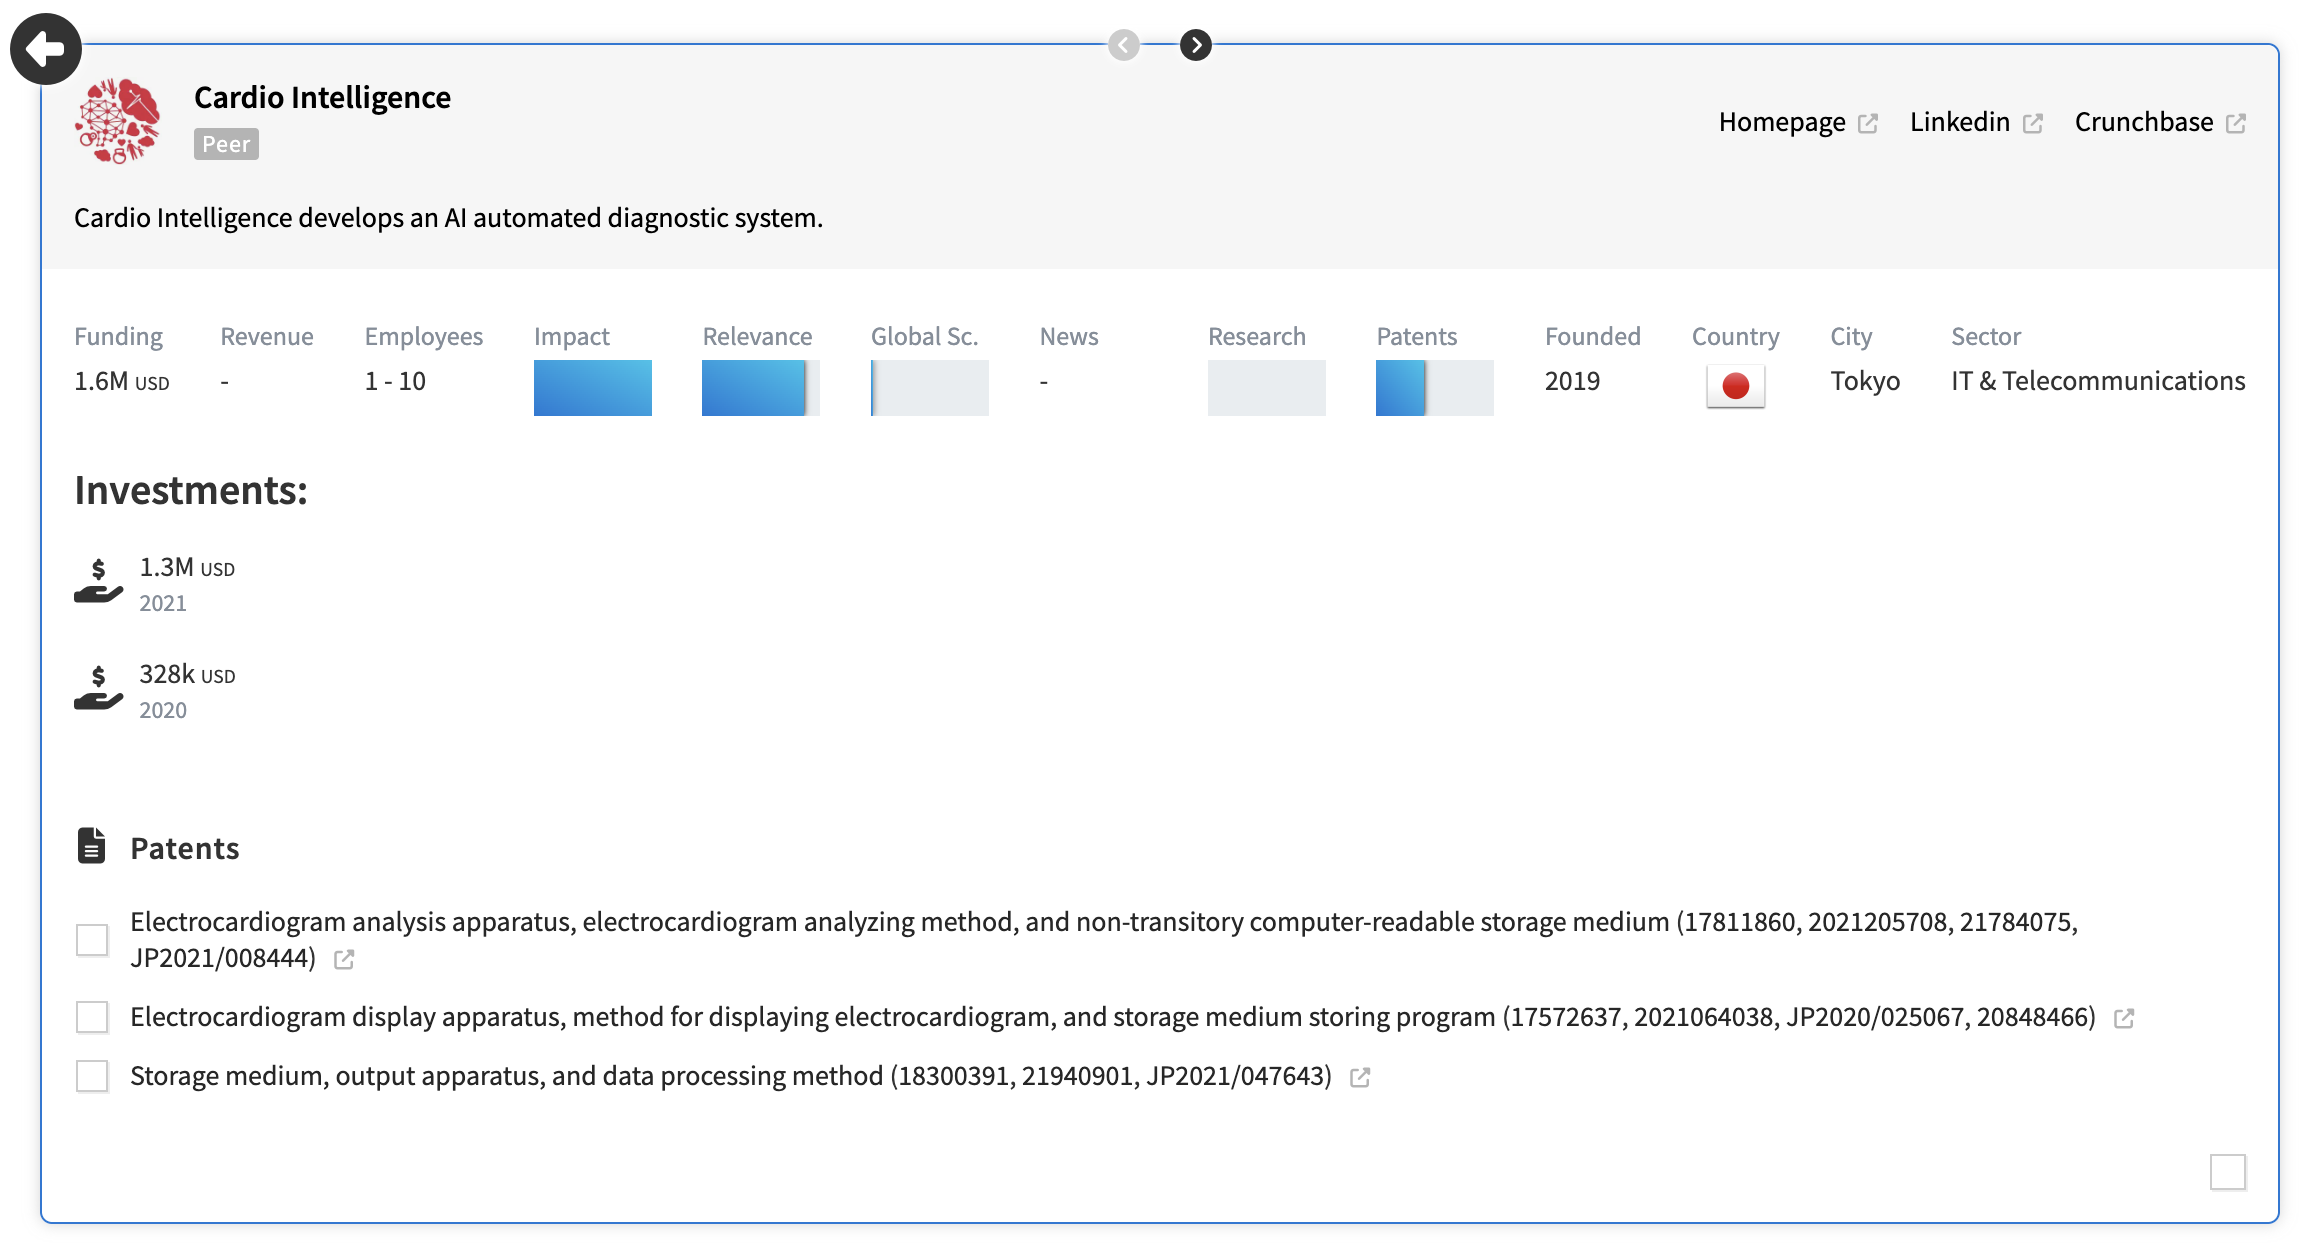
When you click on an organization, the reference section opens, providing detailed information about that specific organization.This section includes:
- A full description of the organization, explaining its purpose and activities.
- All indicators and contextual information, offering a comprehensive view of its characteristics and metrics.
- Matching documents, such as news, patents, research papers, research projects, and standards, relevant to the organization and your query. You may bookmark these publications to any of your projects.
- External links, when available, including the organization's homepage, Wikipedia page, social media profiles, and Crunchbase entry.
- List of investments, detailing the amounts of funding received by organizations and the corresponding years.
You can navigate through the reference section by clicking the arrows at the top.
Panel filters
In the rankings, you can use two types of filters to refine your results and focus on the most relevant organizations:
- Server-Side Filters (Deep Filters): These filters load a completely new set of 500 results. They provide a deeper level of filtering by recalculating the rankings based on your selections, ensuring the new results align with your refined search.
- Country and City. They generate updated results results based on your selection. To use the City filter, you first need to select a country, as the available cities depend on the chosen country. Once the country is selected, you can refine the results further by specifying a city, ensuring the rankings reflect organizations located in your desired region.
- Ranking type. This filter allows you to refine your results by selecting a specific publication type—News, Patents, or Research—when performing topic queries in both lexical and semantic searches. Applying this filter updates the rankings to focus exclusively on the chosen publication type, providing a tailored set of 500 results. We recommend sorting the rankings by the same publication type after applying the filter. For example, if you filter by Patents, use the sorting dropdown to organize the results by patents for a clear snapshot.
The data in these rankings is based on specific timeframes:- Lexical Search: Includes up to 10 years of data for news, patents, and research.
- Smart Search: Includes up to 10 years for news, but only the last 5 years for patents and research to ensure good performance.
- Client-Side Filters (Table Filters): The rest of the filters on the panel work on the current set of 500 results already displayed in the table. They narrow down and organize the existing data without reloading or altering the dataset.
By combining both types of filters, you can effectively explore and analyze the rankings at different levels of granularity.
How to filter
The filter button, located at the top left of the table, allows you to narrow down your results based on the predefined fields above.
Simply click on Filters, choose the field you want to filter by, and set your criteria. The filters will then apply to the 500 results displayed.
Search and sort results
Use the search bar at the top of the panel to explore the 500 available results.
Use the sorting dropdown at the top of the panel to organize the rankings based on a specific field. This helps you focus on the most important aspects of the results and quickly identify organizations that match your priorities.