Compare Library projects
Comparisons help you benchmark fields, topics, companies, materials, risks, and opportunities side by side using standardized live indicators.
- On any subcategory page, switch to List View (toggle at the right side of the search bar).
- Click Fields and select which indicators you want displayed in the table.
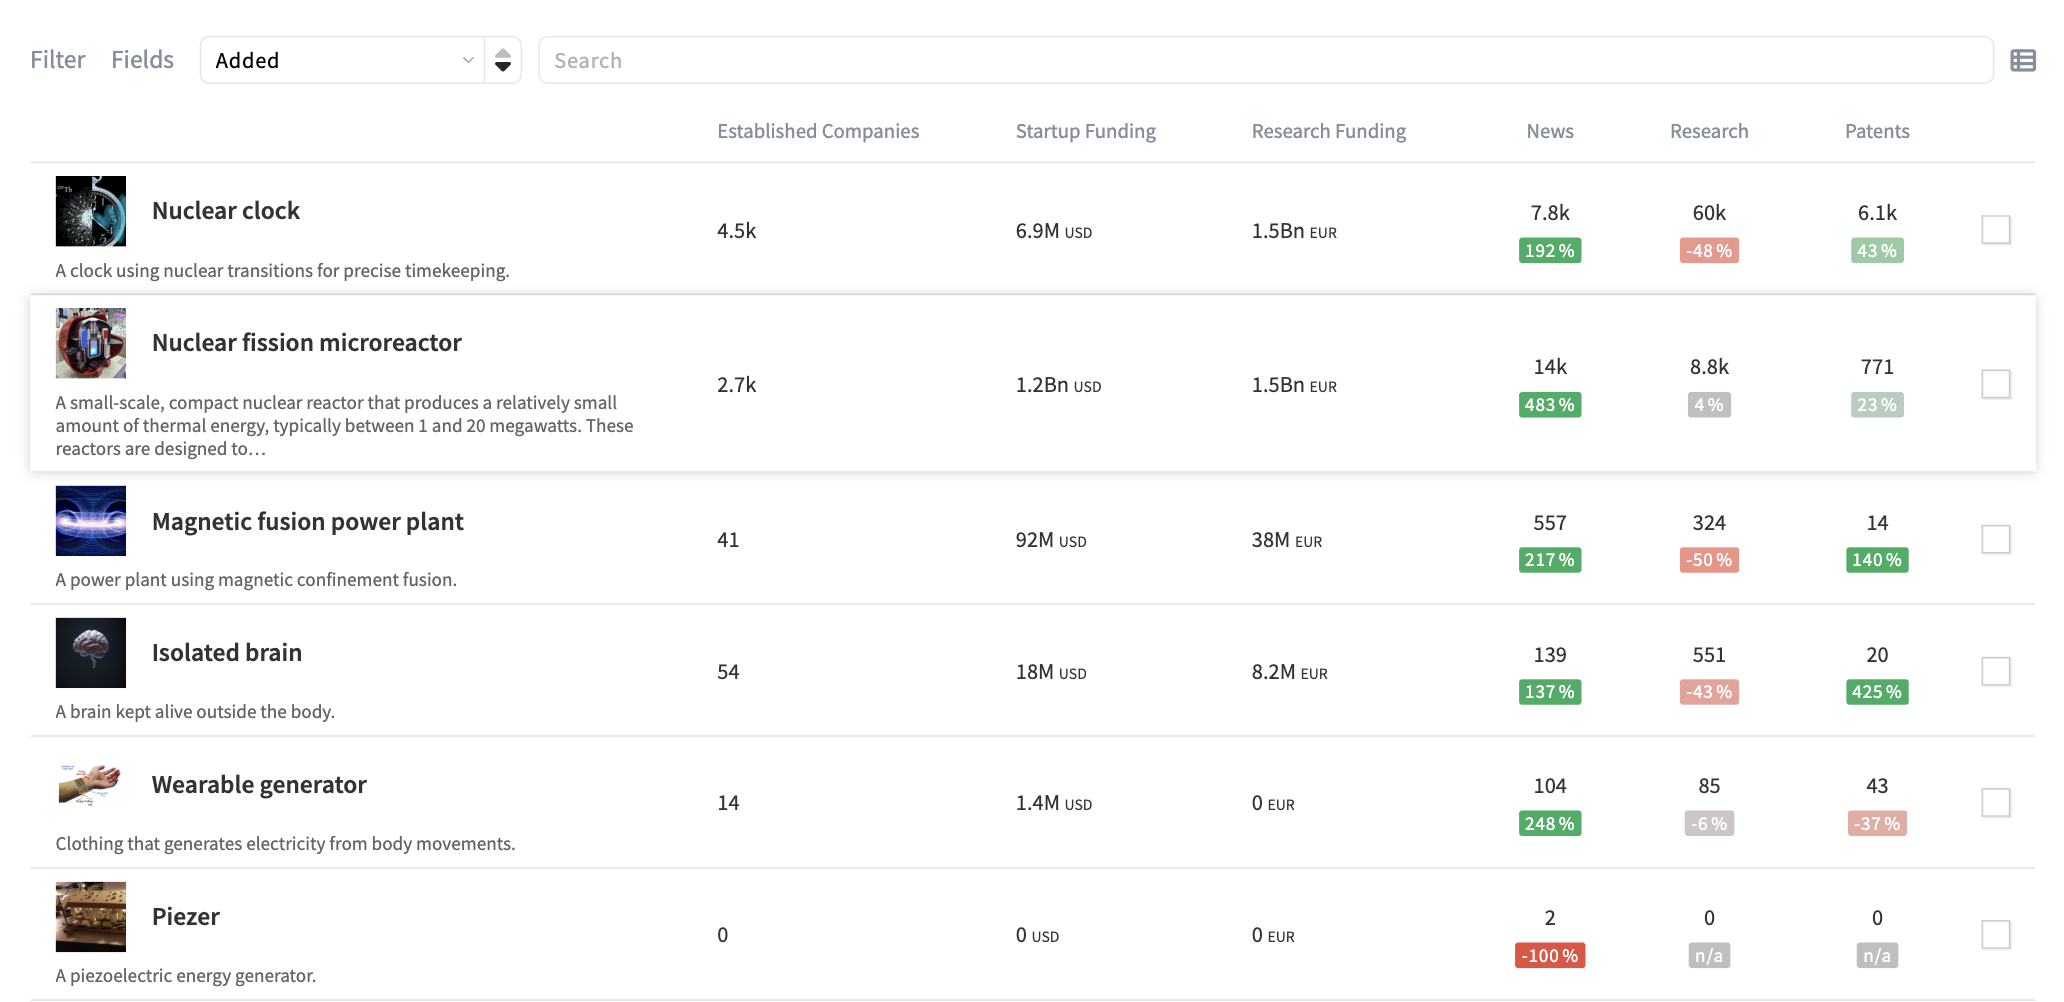
Available indicators
Publication Activity
Tracks news, research, and patent estimated publications related to a queried topic or organization, with insights on growth trends. Insights on publication trends reveal how activity in a particular field or organization is evolving, helping users identify emerging opportunities or threats.
- News. The estimate number of news articles about the queried topic or organization in the past 10 years. A high number may indicate high public visibility of the topic or organization.
News Growth. Tracks the publication rate of news articles over the past year and compares it to the average publication rate from previous years. By comparing the current year's growth to this average, you get an understanding of how much more or less news is being generated in the field compared to the past. - Research. The estimate number of research publications about the queried topic or authored by members of the queried organization in the past 10 years. A high number may indicate high research activity in the field or by the organization.
Research Growth. Compares the number of publications from the past year to the prior average publication rate from previous years. It serves as a historical baseline to understand how the current year's publication rate compares to past trends. - Patents. The estimate number of patent publications about the queried topic or filed by the queried organization in the past 10 years. A high number may indicate high patenting activity in the field or by the organization.
Patents Growth. Compares the publication count from the past year with the average publication rate from earlier years. We also account for the patent publication gap, as patents are often made public only three years after they are filed. For many queries, this means the patent count for the past three years may be zero or very low. To address this, we omit the past three years from the comparison to ensure that patent data accurately reflects the true level of innovation activity.
Company KPIs
For topic queries, Company KPIs are also calculated.
- Established companies. Estimate of the total number of companies that show activity in the space, excluding startups, covering the past 10 years. It helps assess technology maturity, market saturation, commercialization potential, innovation stage. A high number may indicate a high technological maturity since the topic has moved on from early adoption to becoming more widespread among its target audience.
- Startup funding. Estimate of the total funding received by startups in the past 10 years. It indicates market potential, investor confidence, helps spot early-stage opportunities. A high number may indicate high market potential, as investors are willing to fund volatile enterprises.
- Research funding. Estimate of the total funding that research projects have received in the past or will receive in the near future. Indicates technology development, and innovation stage. Reveals government or institutional priorities. A high number may indicate a high technology push, as large financial resources are being put into research.
Related articles