Relevant fields: Topics, Industries, Scientific fields, Tech areas
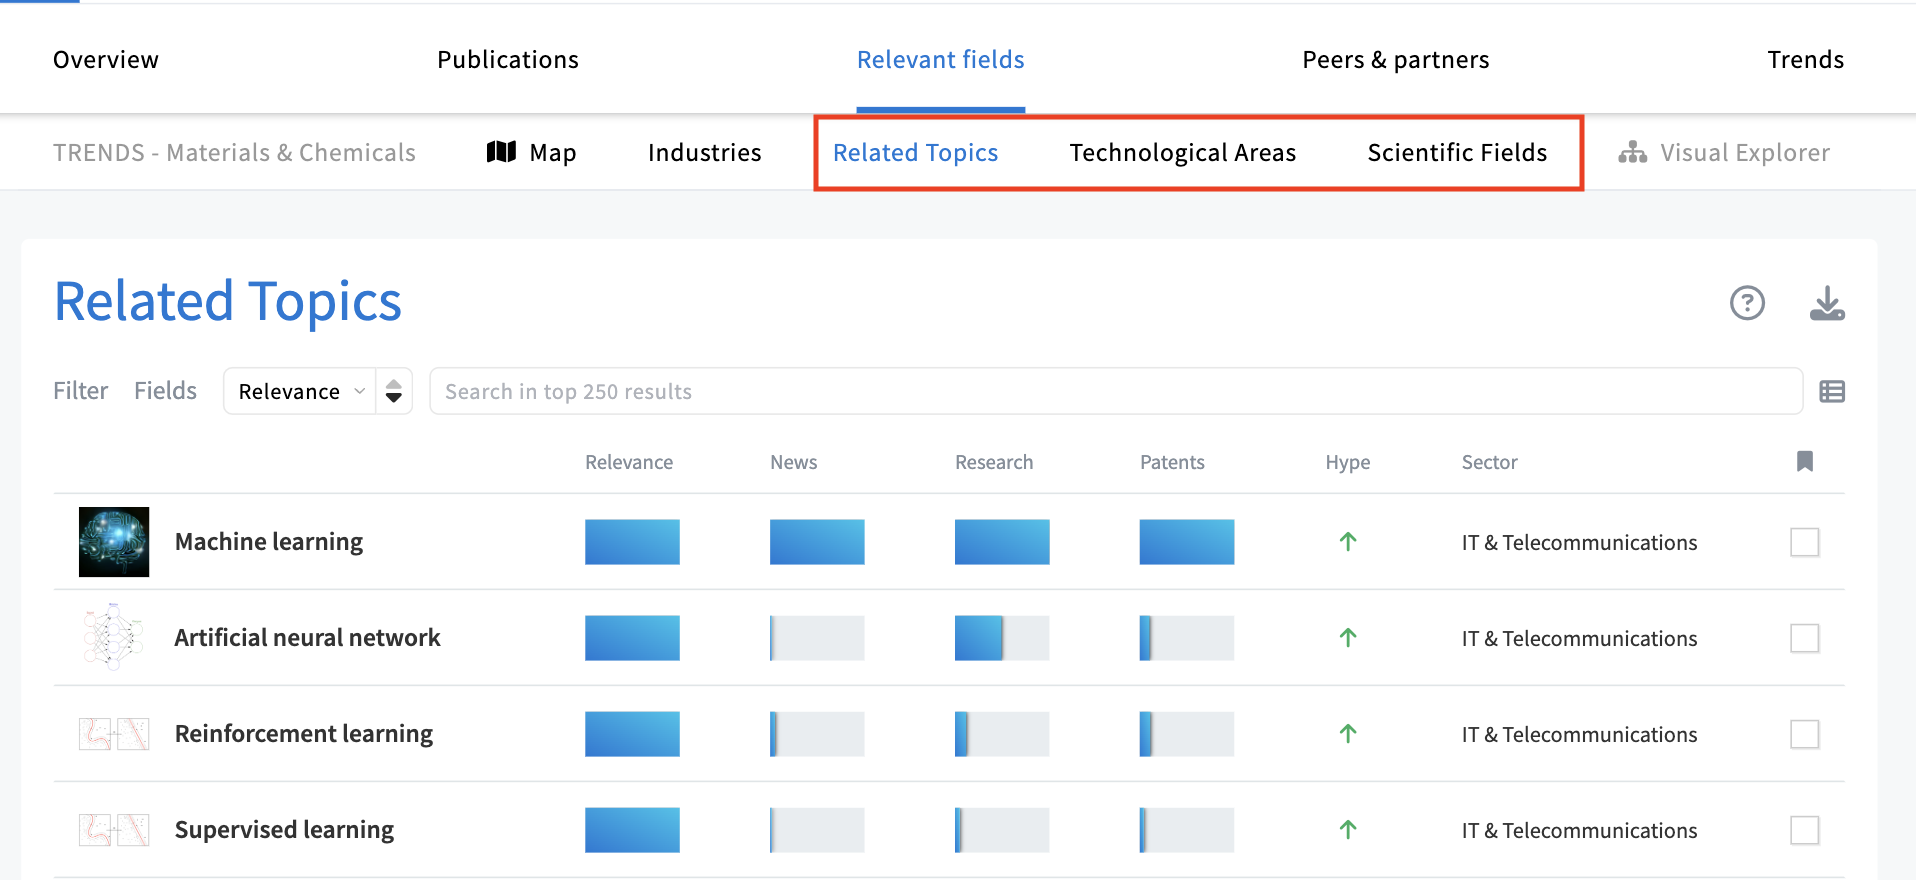
The Related Topics, Scientific Fields, Technological Areas, and Industries rankings offer comprehensive lists of the top 250 categories tied to your search.
Refine your insights, uncover economic sectors, investigate scientific research, and explore patented technologies.
- Related Topics. This panel displays subjects relevant to your search, categorized using MAPEGY's thesaurus to encompass a variety of areas such as technologies, products, materials, methods, and components. This feature helps you identify key trends by highlighting prominent and emerging topics across industries, keeping you informed on what is gaining momentum. It enhances search precision by providing synonyms and related terms, allowing you to refine and expand your exploration for comprehensive insights.
Additionally, it enables you to focus your research priorities by pinpointing high-impact subjects for deeper investigation or potential investment opportunities. - Industries. The Industries panel highlights sectors relevant to your search, organized through an economic taxonomy. This feature maps industries to support application identification and sector alignment, enabling a deeper understanding of market dynamics.
- Scientific fields. The Scientific Fields panel shows domains categorized through a science-based classification, offering context on foundational research. It provides insights into the directions of scientific advancements.
- Technological areas. The Technological Areas panel organizes domains based on patent classifications, offering insights to support technology scouting and strategic planning. It provides a clear view of innovation landscapes, helping you identify advancements and opportunities within your search focus.
Panel fields
The rankings present diverse fields that deliver valuable insights into each item.
- Relevance. This indicator measures how strongly a subject is connected to your query. A higher Relevance score indicates a closer alignment with the search topic or organization.
- Publication activity. This set of indicators provides a percentage-based estimate okey areas:
- News. Represents the relative amount of news publications related to both your query and the field.
- Patents. Reflects the presence of the field in patents within the context of your query.
- Research. Indicates the research activity in the context of both your query and the subject.
- Hype. How much buzz or hype surrounds the subject, based on the number of Trend Signals. Trend Signals are news reports on particularly relevant innovation activity (such as scientific breakthroughs, founding of startups, etc.) and potentially point to triggers of emerging trends. Therefore, in the context of innovation and high technology, a large number of Signals indicate a high public visibility and reach of such reports that you can call hype or buzz, for short.
It is visually represented with arrows to illustrate the level of buzz surrounding a subject. Green arrows signify high hype, indicating strong public visibility and widespread attention. Red arrows represent low hype, suggesting minimal buzz or limited attention. A black arrow indicates a neutral state, where the level of hype remains consistent without significant changes.
When exporting the panel to a spreadsheet, the Hype indicator arrows are converted into numerical values to align with measurable data. Green arrows, representing high hype, correspond to values of 1 or 0.5. A black arrow, indicating a neutral state, is represented by a value of 0. Red arrows, signifying low hype, are translated into values of -0.5 or -1. - Sector. Categories hand-tailored by MAPEGY: Mobility, Electronics & Consumer Goods, Industrials, IT & Telecommunications, Life & Food Sciences, Energy & Infrastructure, Materials & Chemicals, Business & Finance, Culture & Society.
If you want to learn more about these indicators, check out our whitepaper.
How to configure displayed fields
You can customize which fields are visible, tailoring the display to your needs.
Just click on the Fields option on the left side of the screen, and select your preferred fields.
Note: Not all selected fields may be visible in the list view. If this occurs, you’ll see an exclamation mark next to the field settings, indicating adjustments may be needed for optimal display.
Clicking on an item will display full details.
Filter results
The filter button, located at the top left of the table, allows you to narrow down your results based on the predefined fields above.
Simply click on Filters, choose the field you want to filter by, and set your criteria. The filters will then apply to the 250 results displayed.
Search and sort results
Use the search bar at the top of the panel to explore the 250 available results.
Use the sorting dropdown at the top of the panel to organize the rankings based on a specific field. This helps you focus on the most important aspects of the results and quickly identify subjects that match your priorities.
Reference section
When you click on an item, the reference section opens, providing detailed information about that specific subject. This section includes:
- A full description of the field.
- All indicators and contextual information, offering a comprehensive view of its characteristics and metrics.
- Matching documents, such as news, patents, research papers, research projects, and standards, relevant to the suject and your query.
- External links, when available.
You can navigate through the reference section by clicking the arrows at the top.
