Navigate the Library
The MAPEGY Library consists of over 2,000 curated entries.
These entries can be easily added to your portfolio as projects, enabling you to organize and customize your research.
In this article, we will explain the different Library views and how to access content using your preferred classification or filter, making it easier to explore trends and insights tailored to your specific needs.
Library views
The Library offers two distinct views for exploring its content:
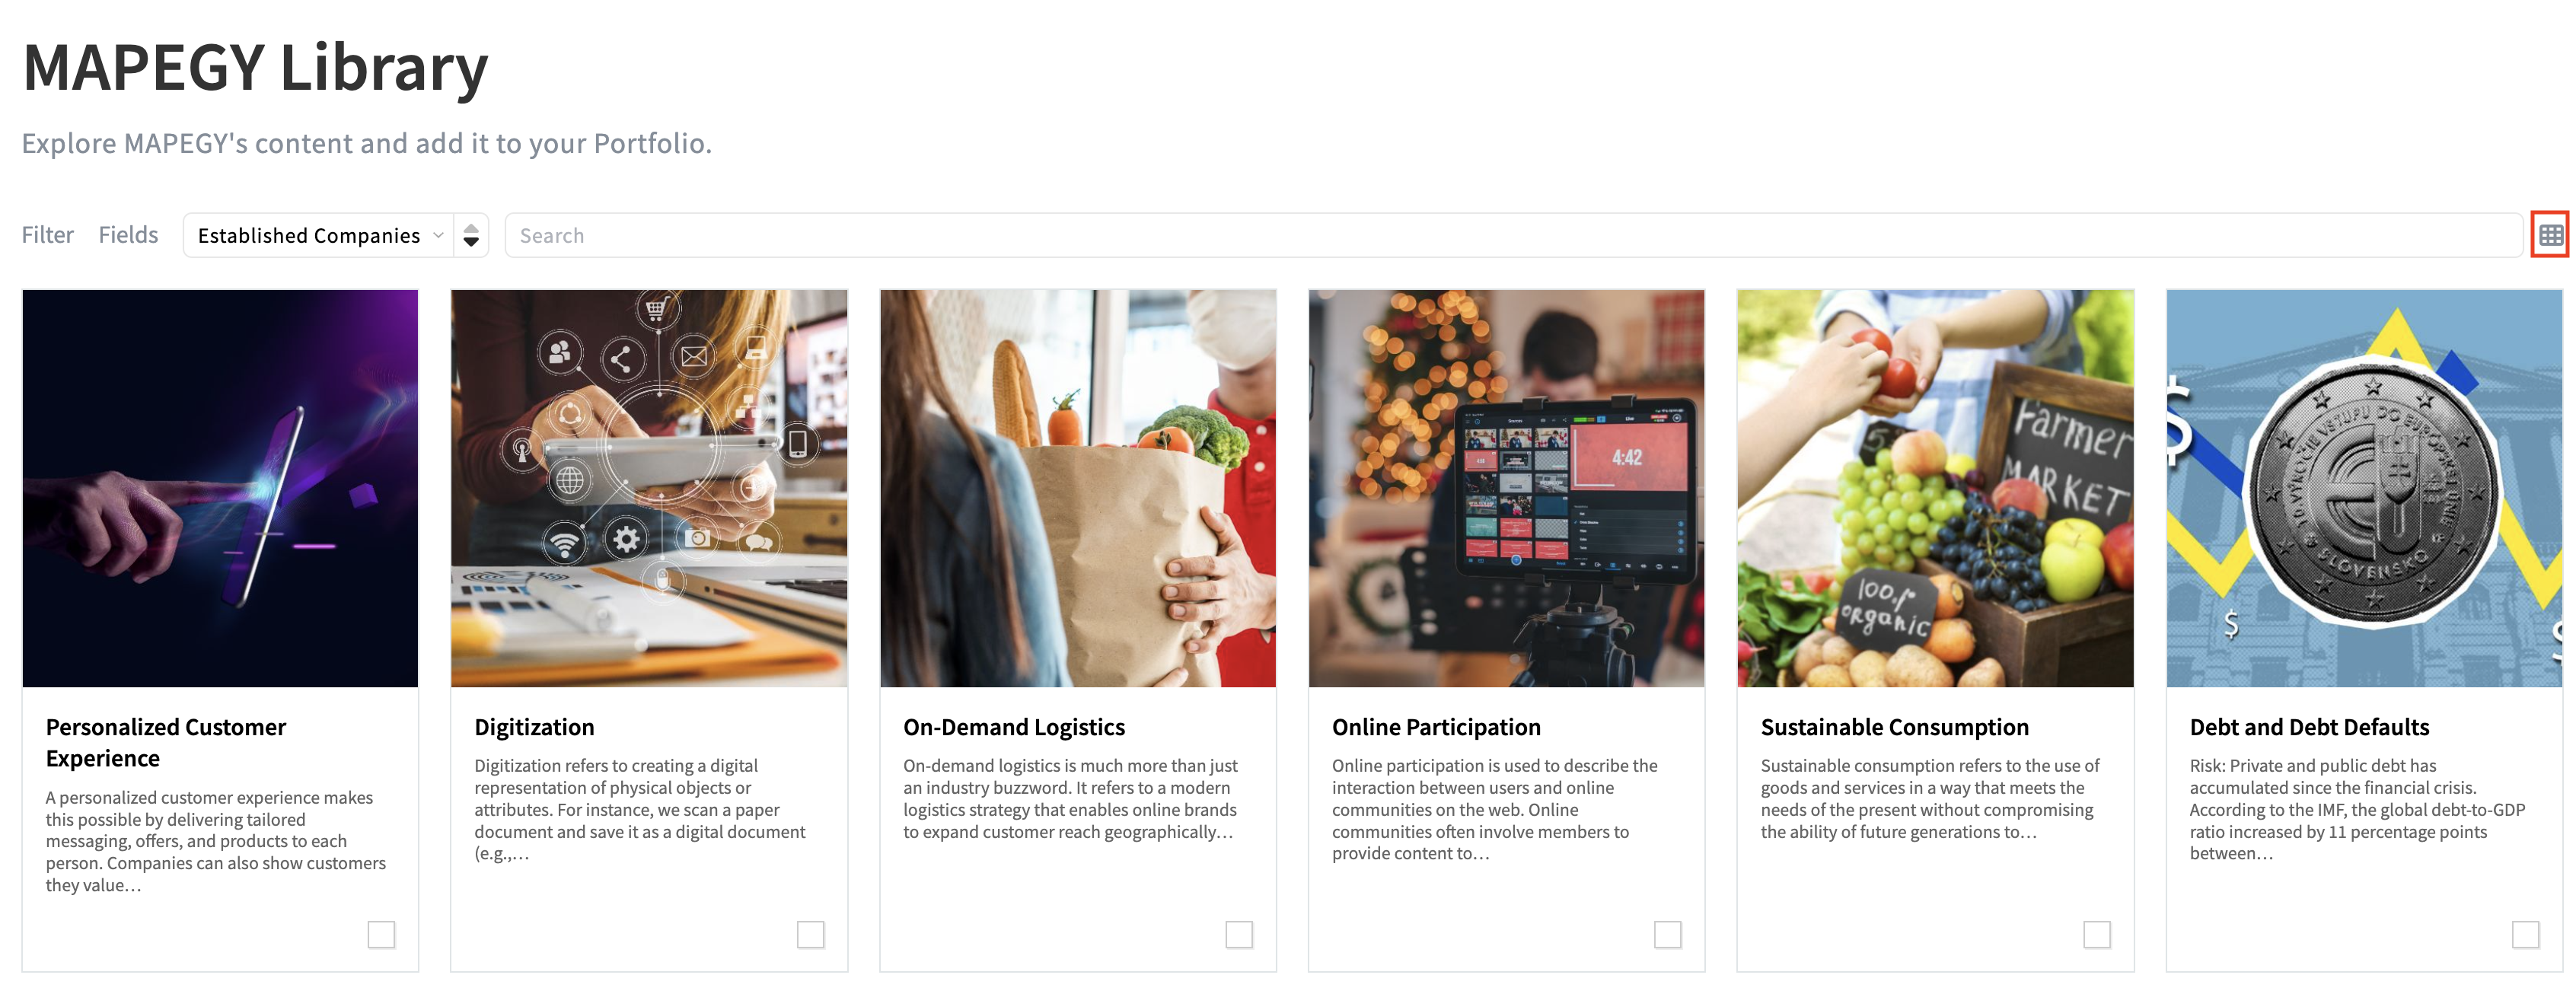
- Grid View: This view provides an overview of entries, featuring key details such as titles, descriptions, and image thumbnails, making it easy to identify trends at a glance.
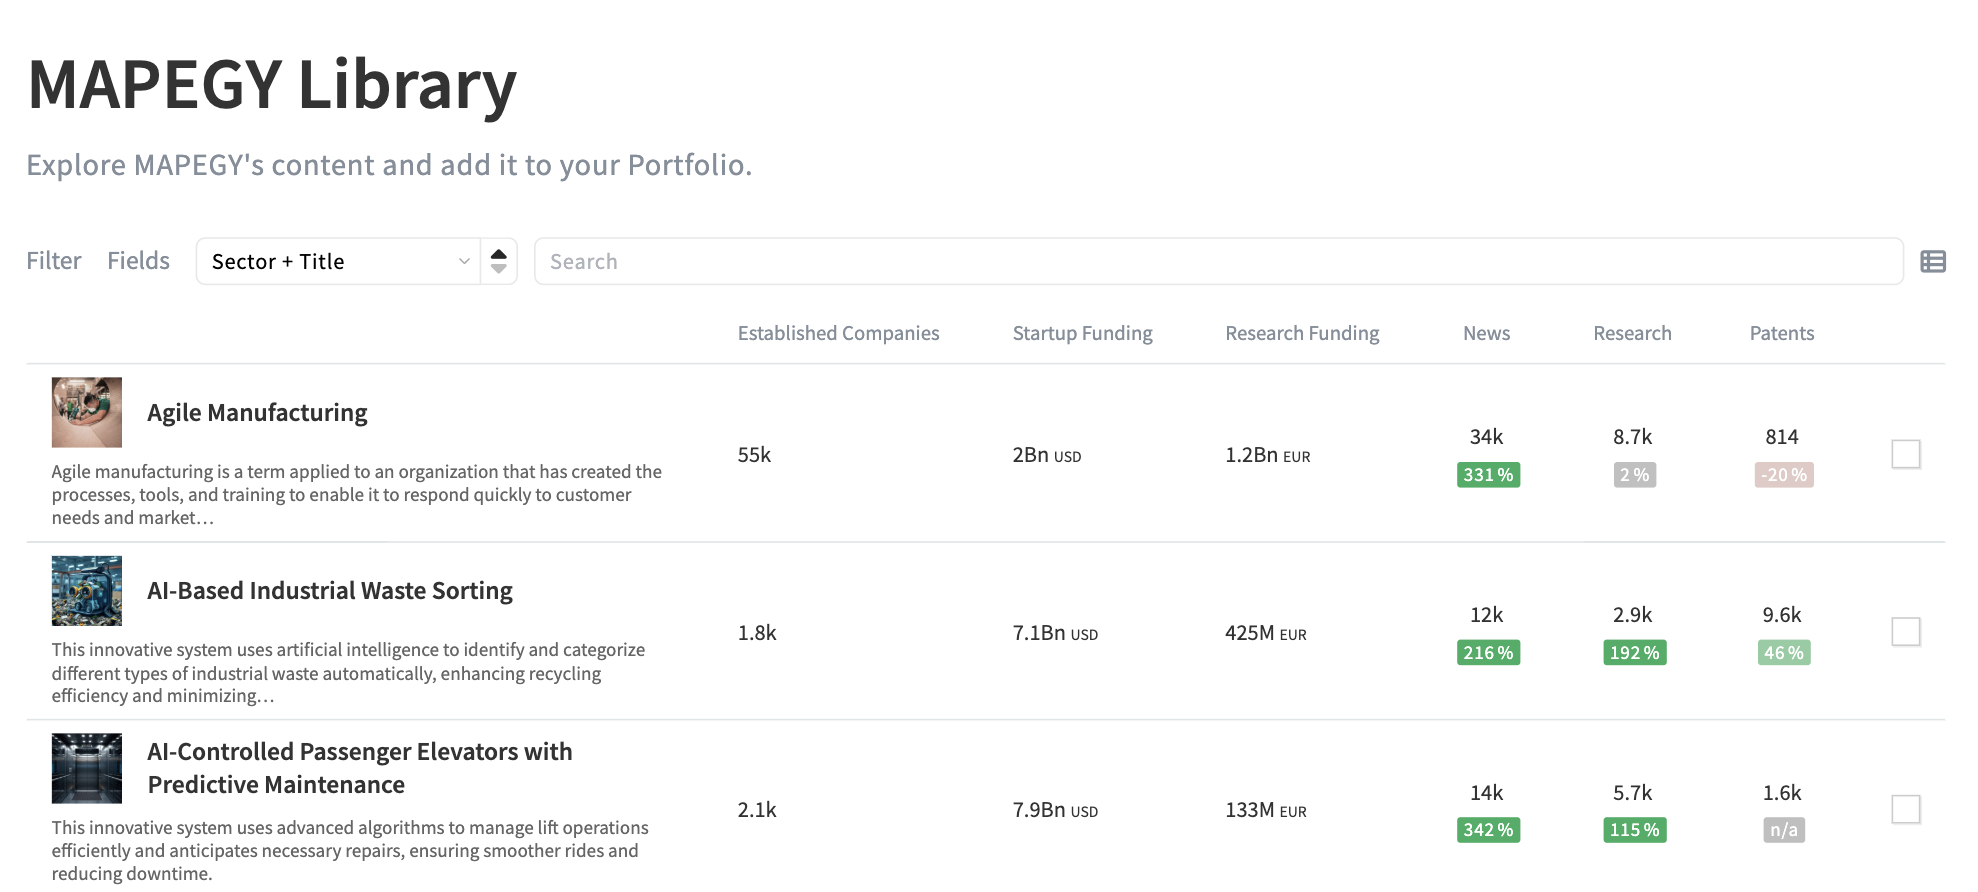
- List View: This view offers a more detailed perspective, enabling in-depth data analysis and the evaluation of Library content based on various KPIs.
To switch between views, simply click the toggle button located next to the search bar.
To add or remove fields from any of these views, read the fields and filter section below.
Library classifications
The Library offers three main classifications to filter entries and tailor your focus:
- Sectors: Automatically assigned to entries, these include Mobility, Material & chemical, Life & food sciences, IT & telecommunications, Industrials, Energy & infrastructure, Electronics & consumer goods, Culture & society, and Business & finance.
- Technologies: Automatically assigned to identify the key technologies associated with each entry.
- Category: Allows you to focus on specific types of risks or trends based on PESTEL factors: Technological, Political, Economic, Environmental, Social, and Legal.
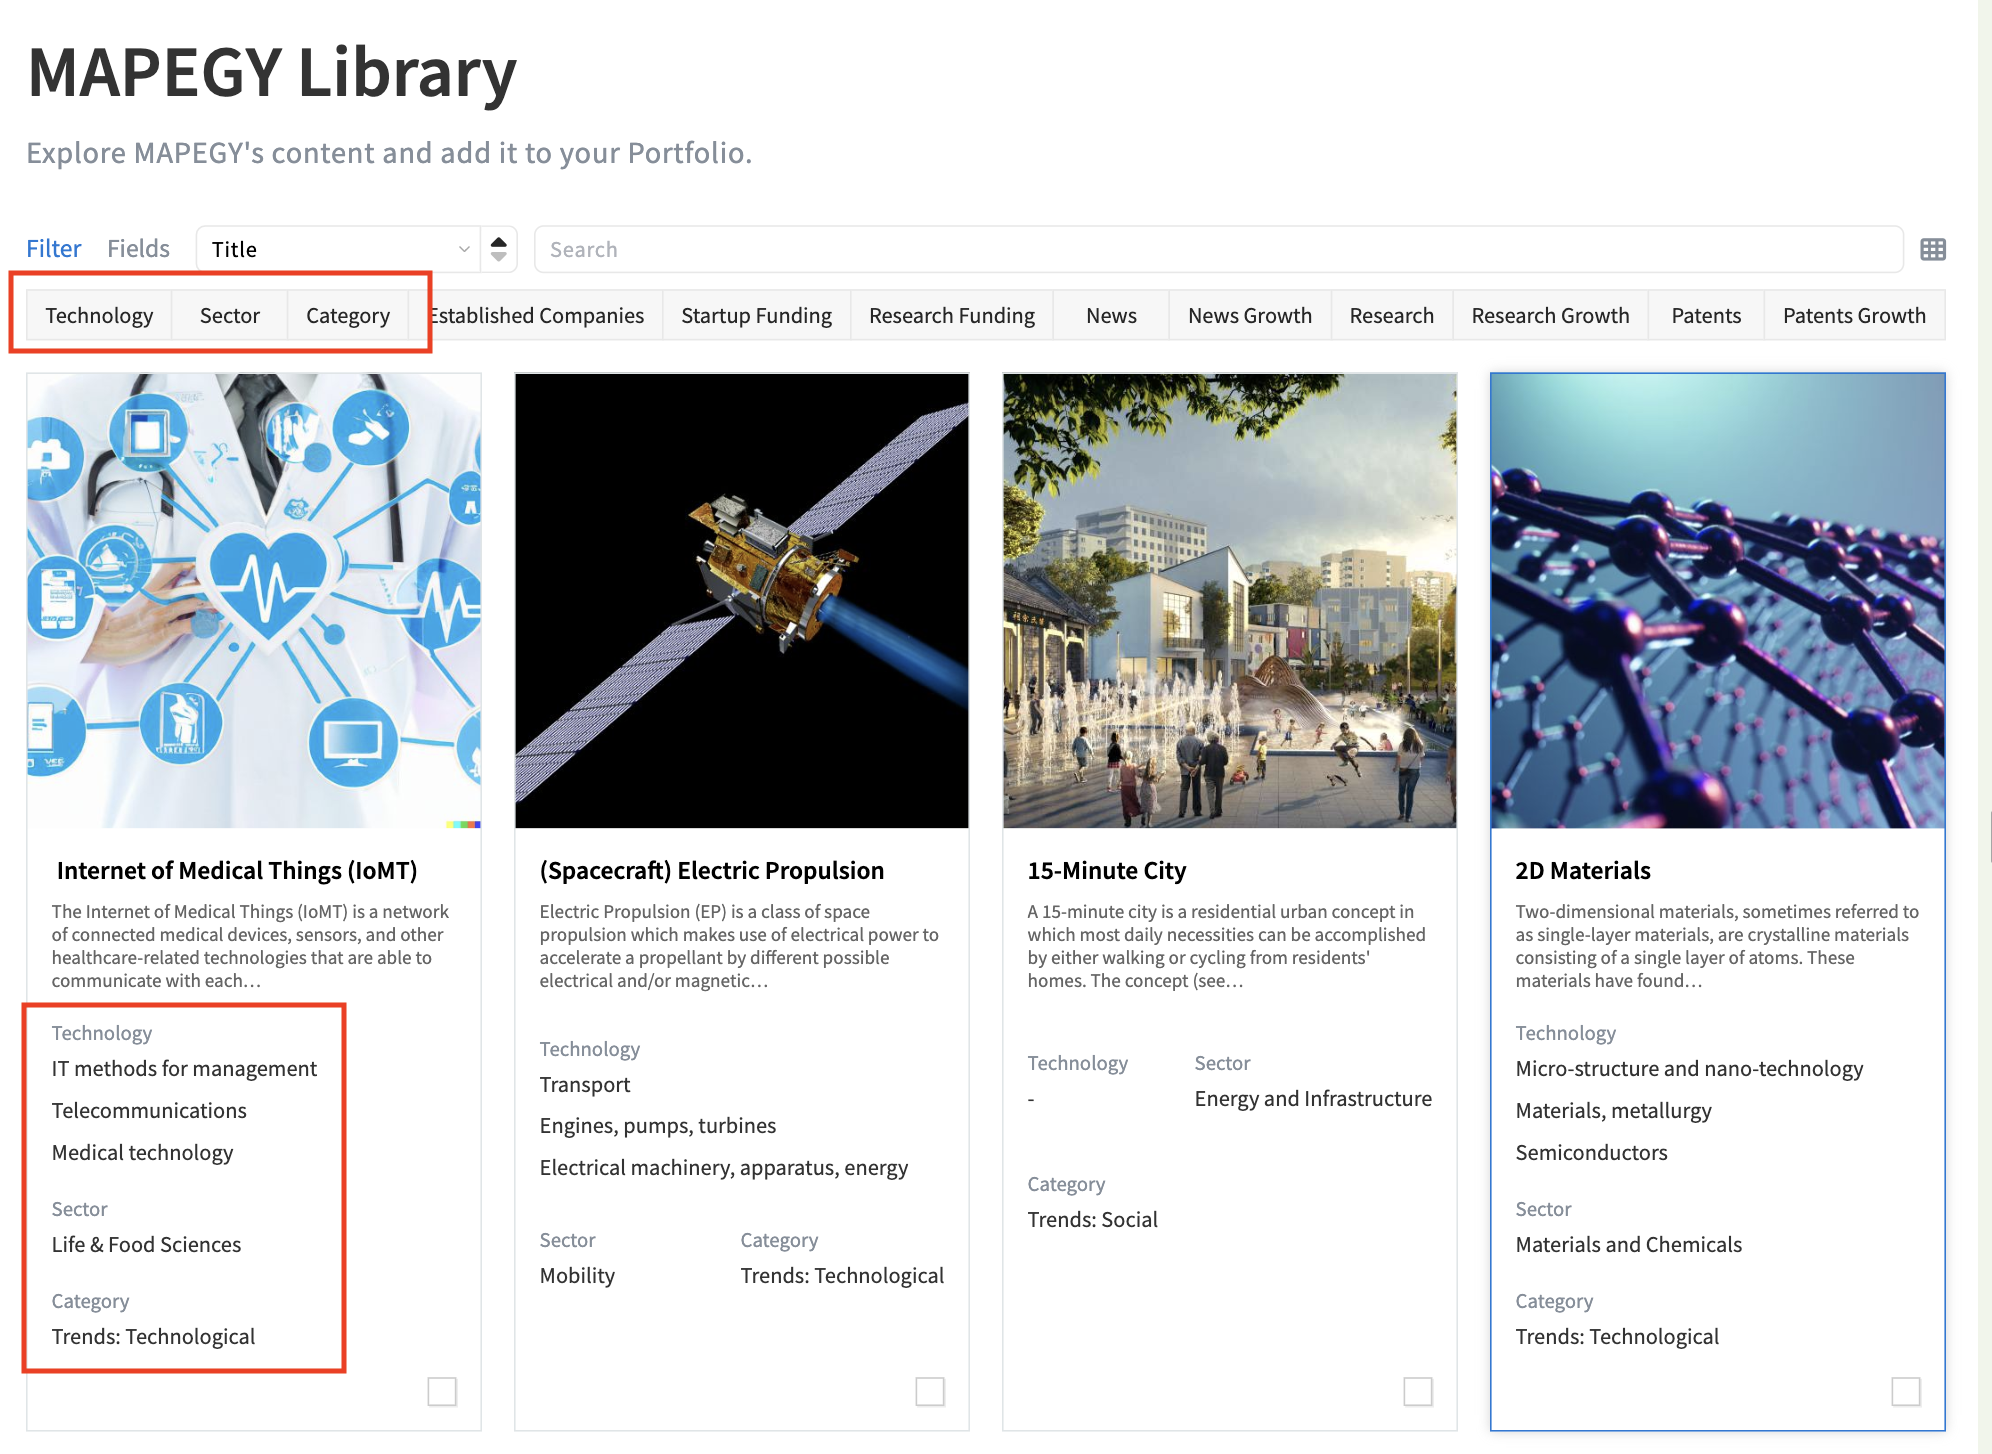
How to choose classification
You can apply multiple classifications at once to refine your Library content and focus on the most relevant trends. Follow these steps to select your preferred classifications:
- Click on Filter at the top of the content page.
- Choose the classification you want to apply: Technology, Sector, or Category.
- A pop-up window will appear, displaying the available options within your selected classification. Browse through the list and make your selections.
- Once you’ve selected the desired filters, click on OK to apply them.
- To clear a filter, simply click on the X next to the applied filter at the top of the page.
Library indicators
The Library also displays MAPEGY indicators for each entry, providing additional insights to help you evaluate trends and technologies effectively.
MAPEGY indicators are automated metrics that provide valuable insights into the broader market and company landscape. These indicators focus on two key areas: Publication activity and Company KPIs.
Publication activity
Tracks news, research, and patent estimated publications related to a queried topic or organization, with insights on growth trends. Insights on publication trends reveal how activity in a particular field or organization is evolving, helping users identify emerging opportunities or threats.
- News. The estimate number of news articles about the queried topic or organization in the past 10 years. A high number may indicate high public visibility of the topic or organization.
News Growth. Tracks the publication rate of news articles over the past year and compares it to the average publication rate from previous years. By comparing the current year's growth to this average, you get an understanding of how much more or less news is being generated in the field compared to the past. - Research. The estimate number of research publications about the queried topic or authored by members of the queried organization in the past 10 years. A high number may indicate high research activity in the field or by the organization.
Research Growth. Compares the number of publications from the past year to the prior average publication rate from previous years. It serves as a historical baseline to understand how the current year's publication rate compares to past trends. - Patents. The estimate number of patent publications about the queried topic or filed by the queried organization in the past 10 years. A high number may indicate high patenting activity in the field or by the organization.
Patents Growth. Compares the publication count from the past year with the average publication rate from earlier years. We also account for the patent publication gap, as patents are often made public only three years after they are filed. For many queries, this means the patent count for the past three years may be zero or very low. To address this, we omit the past three years from the comparison to ensure that patent data accurately reflects the true level of innovation activity.
Company KPIs
- Established companies. Estimate of the total number of companies that show activity in the space, excluding startups, covering the past 10 years. It helps assess technology maturity, market saturation, commercialization potential, innovation stage. A high number may indicate a high technological maturity since the topic has moved on from early adoption to becoming more widespread among its target audience.
- Startup funding. Estimate of the total funding received by startups in the past 10 years. It indicates market potential, investor confidence, helps spot early-stage opportunities. A high number may indicate high market potential, as investors are willing to fund volatile enterprises.
- Research funding. Estimate of the total funding that research projects have received in the past or will receive in the near future. Indicates technology development, and innovation stage. Reveals government or institutional priorities. A high number may indicate a high technology push, as large financial resources are being put into research.
Filter by indicator
Users may also filter Library entries by MAPEGY indicator ranges. This allows you to set specific thresholds for the above KPIs, helping you narrow down entries that meet your criteria and align with your focus areas.
- Click on Filter at the top-left of the page.
- Select the indicator and add the maximum and minimum values.
- Click on OK.
- To remove filters, simply click on the X at the right of the screen.
Edit fields
You can customize which fields are visible in your view. Simply click on the Fields button located on the left side of your screen and select the fields you want to display.
Note: Depending on your screen size, not all selected fields may be visible in the list view. If this occurs, you’ll see an exclamation mark next to the field settings, indicating adjustments may be needed for optimal display.
Search and sort
Sort the Library content by your preferred criteria in either ascending or descending order, using the sorting dropdown at the top of the entries.
Additionally, you can use the search bar to quickly find a specific project.